The market is experiencing a major shift to the RISC-V ISA and MIPS is helping to fuel this transition with high performance RISC-V cores, including debug, trace and performance tools enabling the tools ecosystem. The commercial success of the MIPS architecture can, to some degree, be attributed to deploying advanced debug, trace and performance monitoring tools.
As the chair of the RISC-V International N-Trace TG for the past four years, let me share an important milestone in RISC-V debug, trace and performance monitoring territory. The goal of the RISC-V International N-Trace TG was to utilize the widely used and well documented IEEE-ISTO 5001 Nexus Trace Standard as the basis for an equivalent solution targeting the RISC-V architecture.
There are three fundamental RISC-V Trace specifications:
- RISC-V N-Trace (Nexus based Trace) Specification
- RISC-V Trace Control Interface Specification
- RISC-V Trace Connectors Specification
These went through a lot of scrutiny and are currently declared Frozen and in the Public Review phase with a realistic ambition to become officially Ratified ahead of the upcoming RISC-V Summit North America in October 2024.
PDFs with Frozen RISC-V Trace specifications can be found here:
https://github.com/riscv-non-isa/tg-nexus-trace/releases/tag/1.0_rc50_Frozen
Let me elaborate a bit more on each of these specifications …
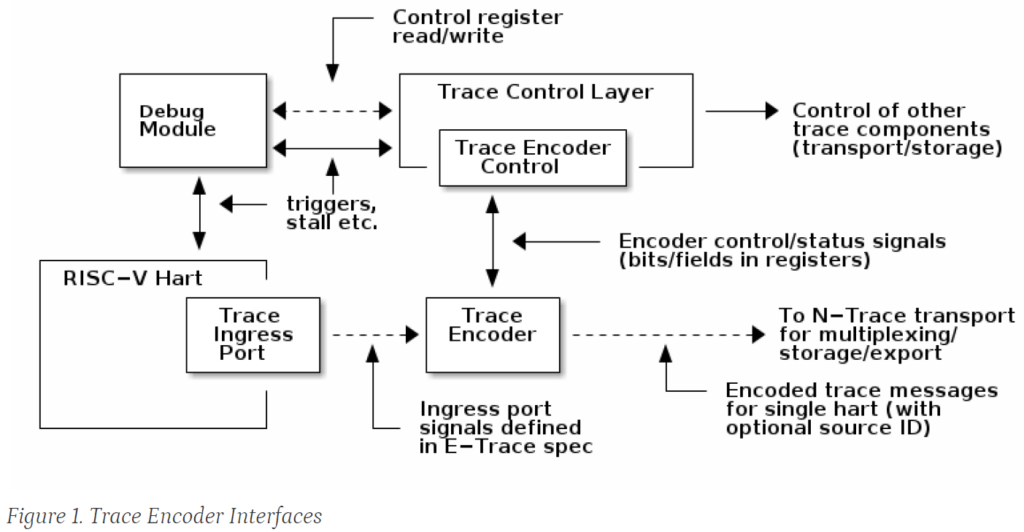
RISC-V N-Trace (Nexus based Trace) defines a trace encoder component and was built on top of the well-established Nexus IEEE-ISTO 5001 standard. Compressed trace messages are used to encode program execution and other important events. These trace messages are highly compatible with the well-known Nexus standard, but the N-Trace specification proposes some constraints and several enhancements to make sure trace for RISC-V will be both easier to implement from a hardware perspective and result in better trace compression. C code references are also provided along with explanations to help guide IP implementation and verification. The N-Trace specification also allows well compressed timestamping of important events during execution to provide a deeper understanding of performance in addition to instruction history. Relations of N-Trace encoder to other components in the SoC is described by this diagram (taken from the spec):

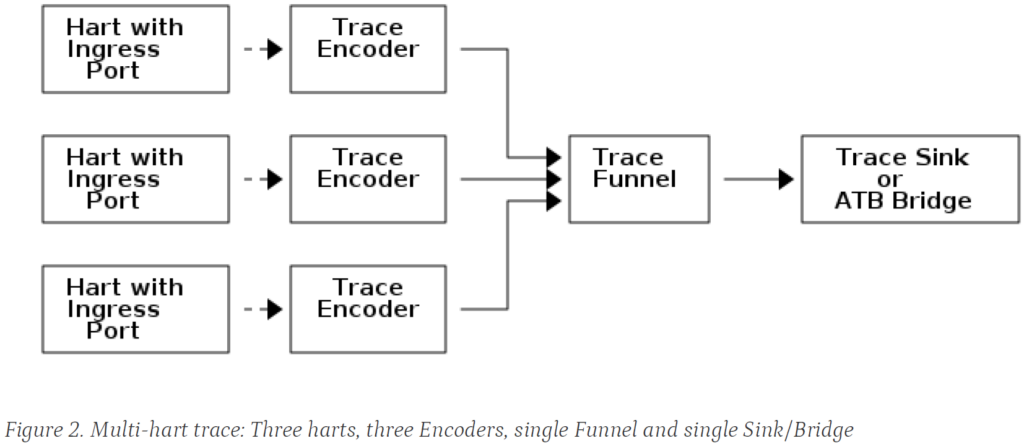
RISC-V Trace Control Interface defines a control interface for collection of trace components to encode, transport, store, read and stream the trace data. This interface defines sets of memory-mapped registers, which can be used to enable, filter and access trace of code running inside of SoC. Here is an example of connection between different trace components (taken from the spec):

Trace Sink (endpoint for generated trace) can be either RAM storage or Pin Interface Block which will be used to stream the trace out of SoC.
RISC-V Trace Connectors Specification defines two trace connectors (slow 4-bit, and fast 16-bit) which allows ALL tools and probes already supporting other popular ISA (over the last two decades) to be used as-is with RISC-V based SoCs and boards. Additionally, some small, optional, enhancements are defined (dual voltage and power-delivery) to address important use cases.
To provide a complete picture, RISC-V International also provides several other debug, trace, and performance monitoring specifications which are Ratified or close to ratification:
- RISC-V Debug Specification 1.0 (key update from 0.13.2 ratified over 5 years ago).
- RISC-V E-Trace Specification (different packet encoding, an alternative to N-Trace). It will share RISC-V Trace Control Interface and RISC-V Trace Connectors specs.
- RISC-V CTR (Control Transfer Record) Specification – it provides shallow trace buffer (last 32 branches/jumps ….) to be utilized at the kernel level to provide cycle-accurate samples of history of execution.
Several other trace, debug and performance monitoring related groups are at earlier stages of development. Some down-compatible N-Trace enhancements/additions will also be proposed once N-Trace 1.0 is officially declared Ratified.
As an engineer at hart (pun intended), I could not resist to share some technical details.
Best N-Trace compression (averaged across several embedded benchmarks) is about 0.2bits/instruction. N-Trace compression results were presented during the very first “N-Trace for RISC-V Explained” technical session available here:
https://sites.google.com/riscv.org/riscv-technical-sessions/home?authuser=0#h.izoeg8nnxrp
![]()
To put above “Best compression=0.2bits/instruction” it into perspective, 1GHz core running with 1 IPC (Instruction/Cycle) efficiency will produce 200Mbps of execution trace. The 16-bit dual edge trace port needs to be clocked at 6.25MHz. It means that tracing of 8 cores will require only 50 MHz trace clock. I used the term ‘only’, as the 16-bit trace connector and professional trace probes can handle clocks up to 200MHz. This means such a probe can sink trace from either 32x1GHz or 8x4GHz cores without dropping any trace packets. Not so bad I have to say …
If your SoC will not have an external trace port, an internal trace buffer of 32MB (small size if carved out of usually large DDR) will be enough to hold the trace from 1.28s of execution. This might not sound like a lot, but in the same 1GHz core with 1PC, 1.28s is enough to store the most recent 160 million instructions executed. Having such a history (before a problem) will certainly allow programmers to find those hard-to-find bugs.
MIPS cores will provide full compatibility with all Ratified RISC-V debug, trace and performance monitoring specifications. In addition to open-source infrastructure, we will work with all professional debug and trace tool vendors to assure full support is provided.
We will continue to push new, interesting, trace and performance measurement features. Some of these will be a retrofitting of cool features available in well-known legacy MIPS cores. Stay tuned 😊 .
Summary
Being able to see so many instructions, users can now really learn how the code runs and understand it, which is especially important when you run a code you did not write (what is often the case these days). Having good visibility into a flow and associated timestamps, you may even attempt to optimize it.
Trace is great, but often misunderstood technology. People pull the trace when nothing else works. I am an advocate of using trace in everyday work. By making Trace available and easily accessible to end users, hopefully the days of using print statements to debug software will be a thing of the past.
Happy coding and tracing!


